Workspace & monitoring
This page is a tour of the screens you’ll spend most of your time in once Cortiq is set up. By the end you’ll know which screen answers which question and the daily rhythm that ties them together.
What this is
Section titled “What this is”After installation and the first session, you stop thinking in terms of features and start thinking in terms of screens. The workspace is the daily operating surface: where you start sessions, watch them run, review what happened, and decide what to change next.
Cortiq groups these screens under Library in the sidebar, with one diagnostic screen under Tools. Each one answers a specific operational question — what’s running right now?, did today go well?, why did the AI take that trade?, is the provider healthy? — and the answer lives on exactly one screen.
This page introduces each screen and recommends a daily rhythm. The deeper “why” of each entity (sessions, journals, trade ideas) lives on its own dedicated page.
How it fits into Cortiq
Section titled “How it fits into Cortiq”| Screen | Question it answers | Lifecycle phase |
|---|---|---|
Home | What’s running right now, and what should I do next? | Orientation |
Dashboard | Is the platform healthy across all my accounts? | Monitoring |
Sessions | What is each running session doing right now? | Active operation |
Trade Ideas | Which standalone theses are open and what’s their status? | Active operation |
Journal | Why did this trade or session behave that way? | Review |
Session Reviews | What did the AI learn from completed sessions on this instrument? | Review |
Cohorts | Which configuration is outperforming the others? | Review |
Conversations | What is the AI actually saying across sessions? | Review / debug |
System Messages | What background events and trade operations have fired? | Monitoring |
Provider Health | Is the AI provider reliable and authenticated today? | Diagnostics |
How to use it
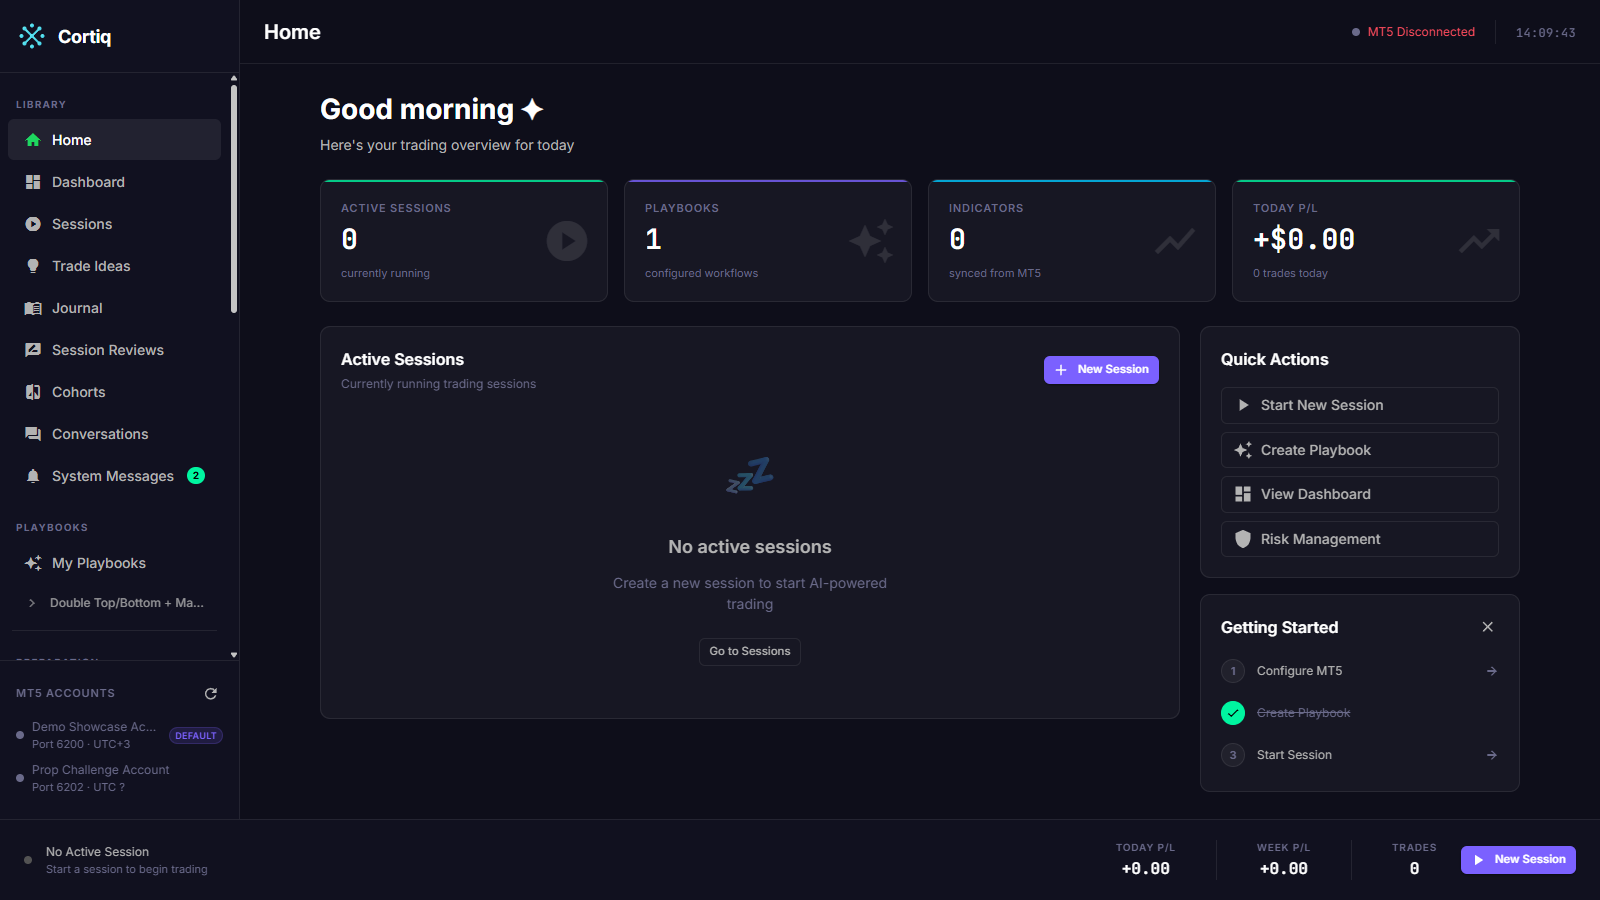
Section titled “How to use it”Home is the daily landing screen. It shows the count of running sessions, today’s P/L at a glance, quick actions to create a session or open risk management, and a getting-started checklist while the app is still new.
Use Home to orient before opening any detail screen.
Dashboard
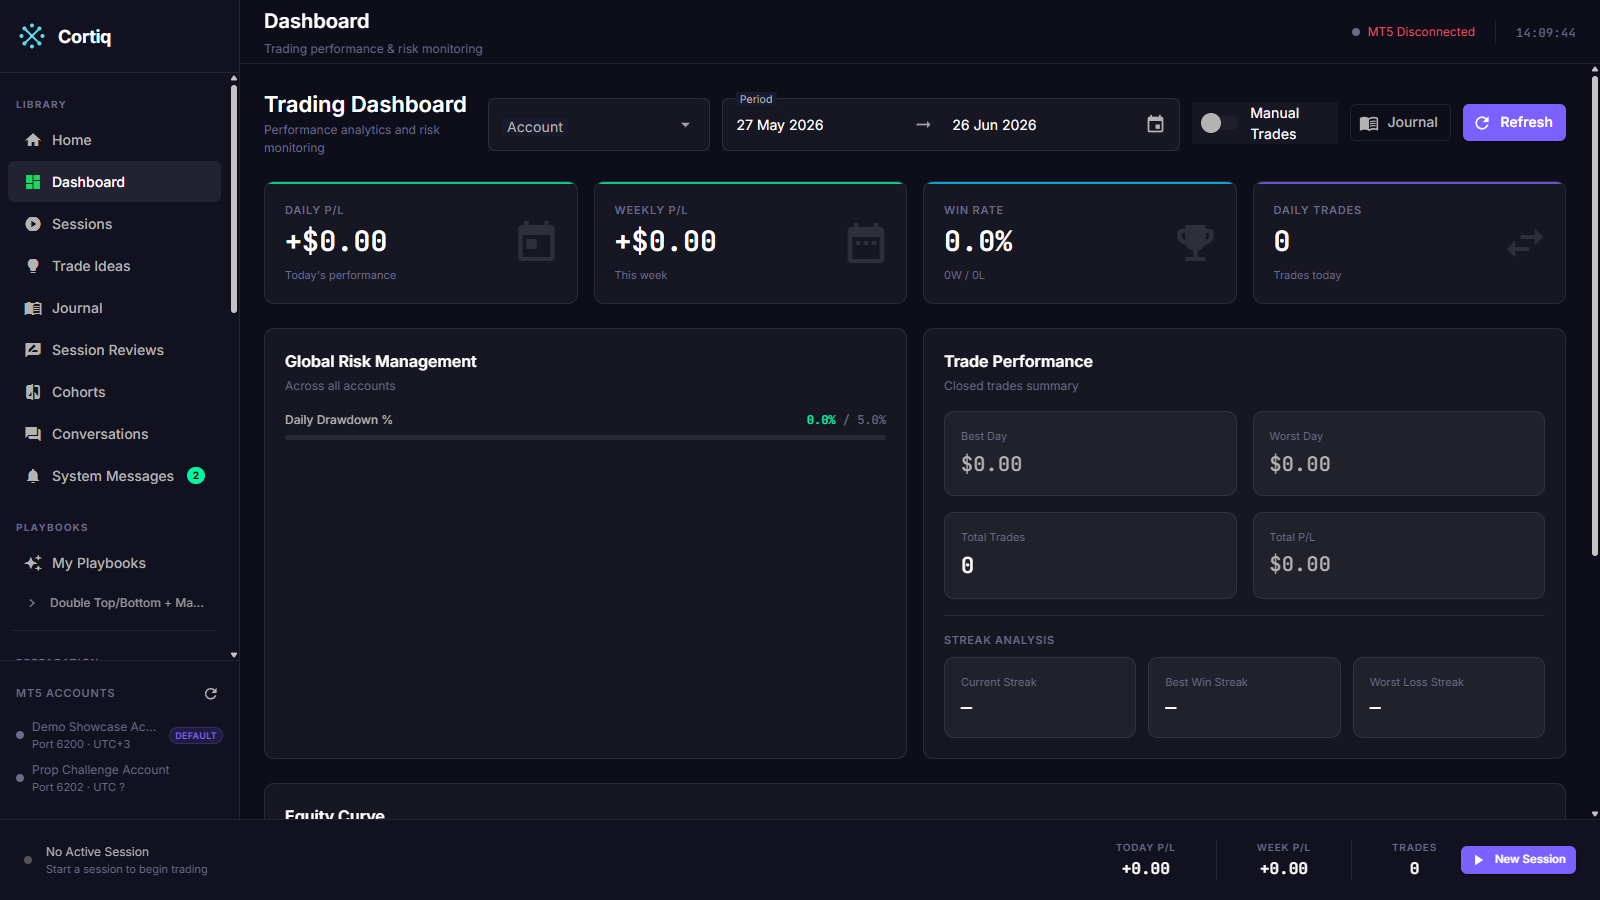
Section titled “Dashboard”Dashboard is the broader operating view across every account Cortiq is connected to. It shows cross-account P/L, recent trades, and global risk status.
Open Dashboard when you want the business-level view of the platform — not “what is this session doing”, but “is the whole environment behaving”.
Sessions
Section titled “Sessions”Sessions is where you control runtime state. The list view shows every session with its current state (Running, RiskPaused, TimePaused, Stopped, Completed, Failed); the detail view drills into one session’s live execution feed and AI conversation.
You start, stop, and resume sessions from here. You also use this screen to follow a single session through its cycle when something looks off. The list and detail screens are covered in depth on the Sessions page.
Trade Ideas
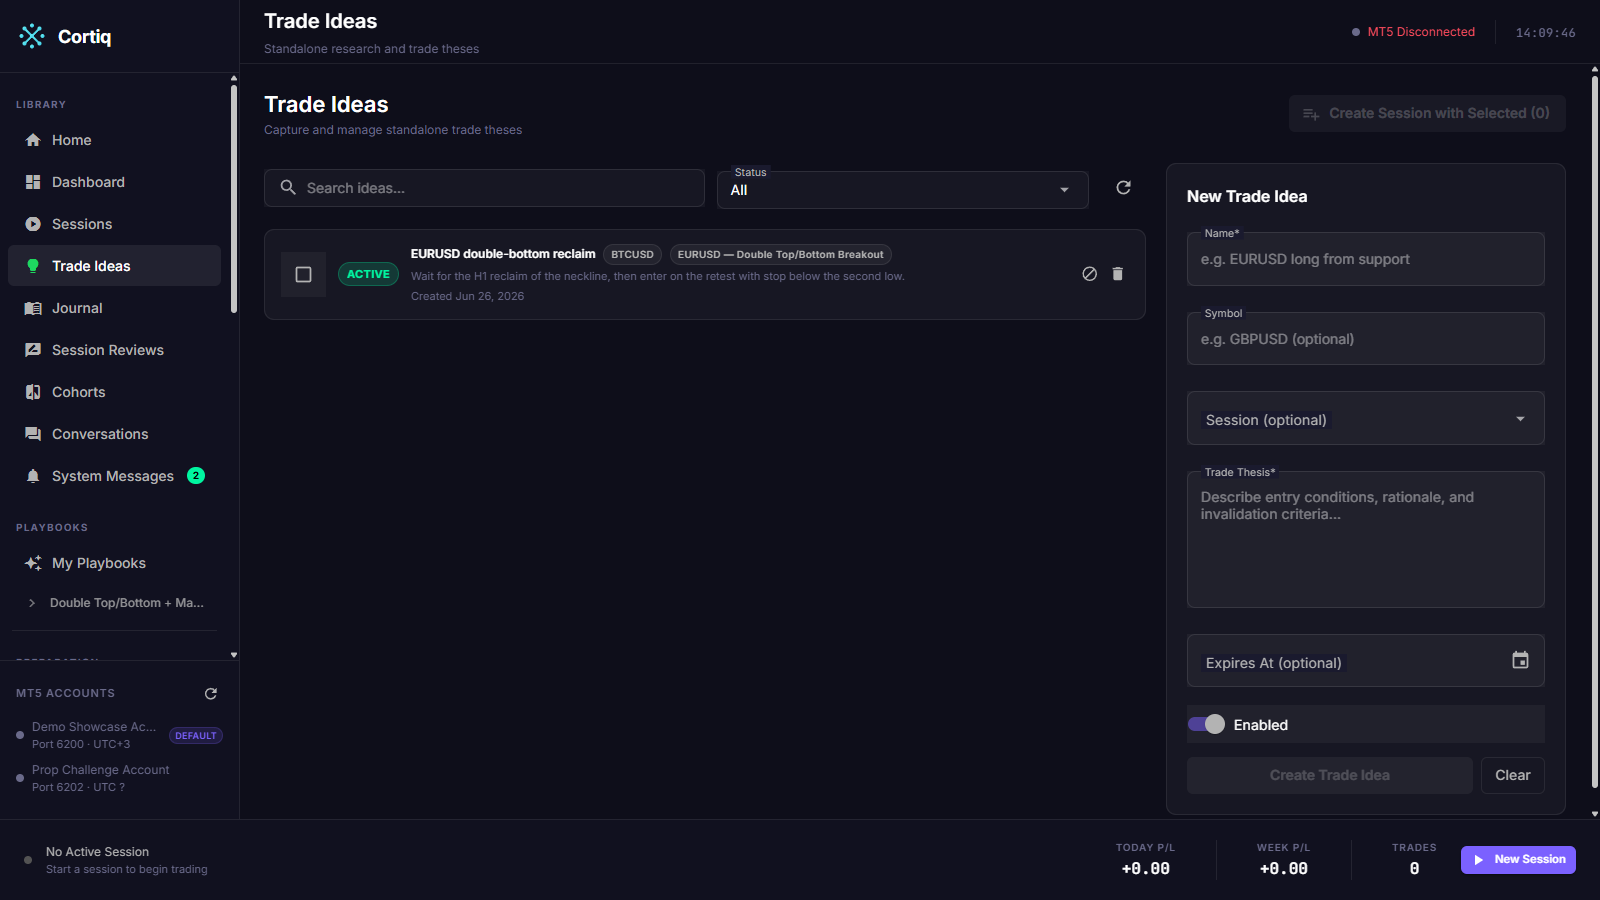
Section titled “Trade Ideas”Trade Ideas is for standalone theses that don’t belong in the reusable playbook library. Use it when you want Cortiq to follow a specific opportunity without pretending it’s part of your core strategy framework.
You can filter ideas by status (active, executed, closed, invalidated, expired, unassigned) and create a session directly from an active idea.
Journal
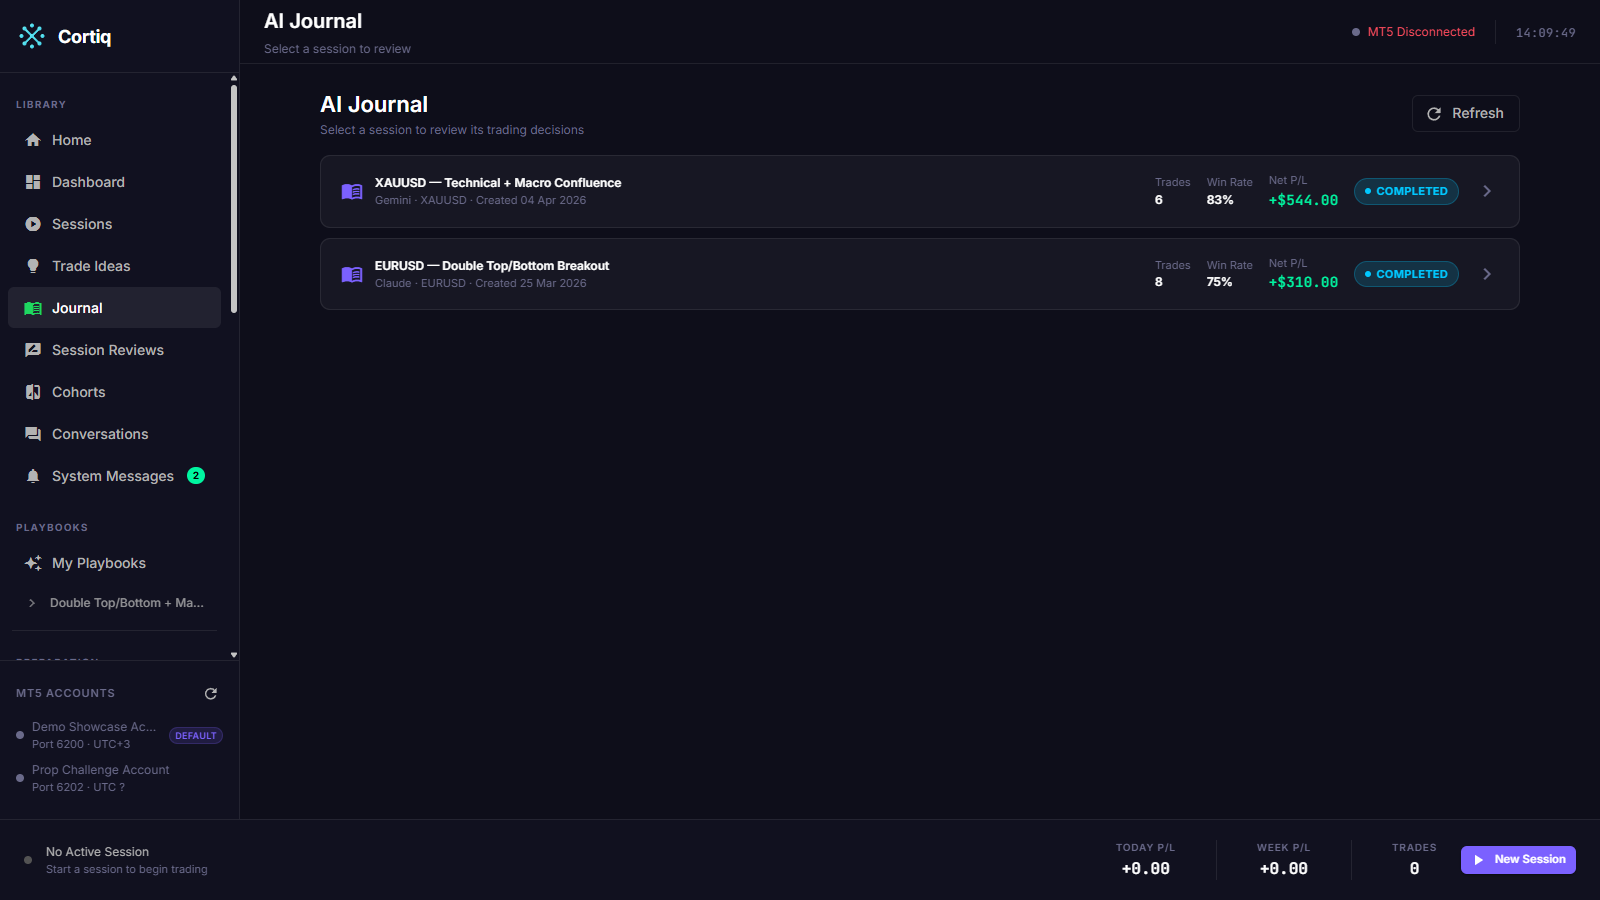
Section titled “Journal”Journal is the main review surface. It splits into two views:
AI Journal— session-level review, including the AI-generated narrative for each cycle.Trade Journal— per-trade deep dive, with the conversation that produced the entry attached.
Use Journal when you need to understand why a session or trade behaved the way it did, not only whether it won or lost.
Session Reviews
Section titled “Session Reviews”Session Reviews (/reviews) lists the AI-driven reviews produced after sessions end. Each review yields scored, apply-able suggestions and durable instrument-scoped lessons that feed back into the next session on the same symbol. Filter by instrument to see the active lessons the AI loop currently knows for that market.
Open this screen to close the learning loop — to see what a completed session taught and to apply or dismiss the proposed changes. The full mechanism is on the Session review page.
Cohorts
Section titled “Cohorts”Cohorts groups sessions into a comparison set. It’s the right screen when more than one serious session is running and you need to decide what deserves more capital or more refinement — relative performance, not isolated anecdotes.
There’s no dedicated screenshot for this page in the current pass; the comparison view evolves quickly and is documented under Journal & analytics.
System Messages
Section titled “System Messages”System Messages (/system-messages) is the in-app notification center. It is a persisted, filterable list of background-process events and trade operations — preparation auto-refreshes, risk pauses, MT5 feed health, trade opens/closes/failures, and agent permission requests. An unread badge sits next to the entry in the sidebar, and higher-severity events also raise a toast.
Open this screen to find out what happened while you weren’t watching. Permission requests here are actionable — you can Allow or Deny an agent capability directly from the row. See System messages for the event list.
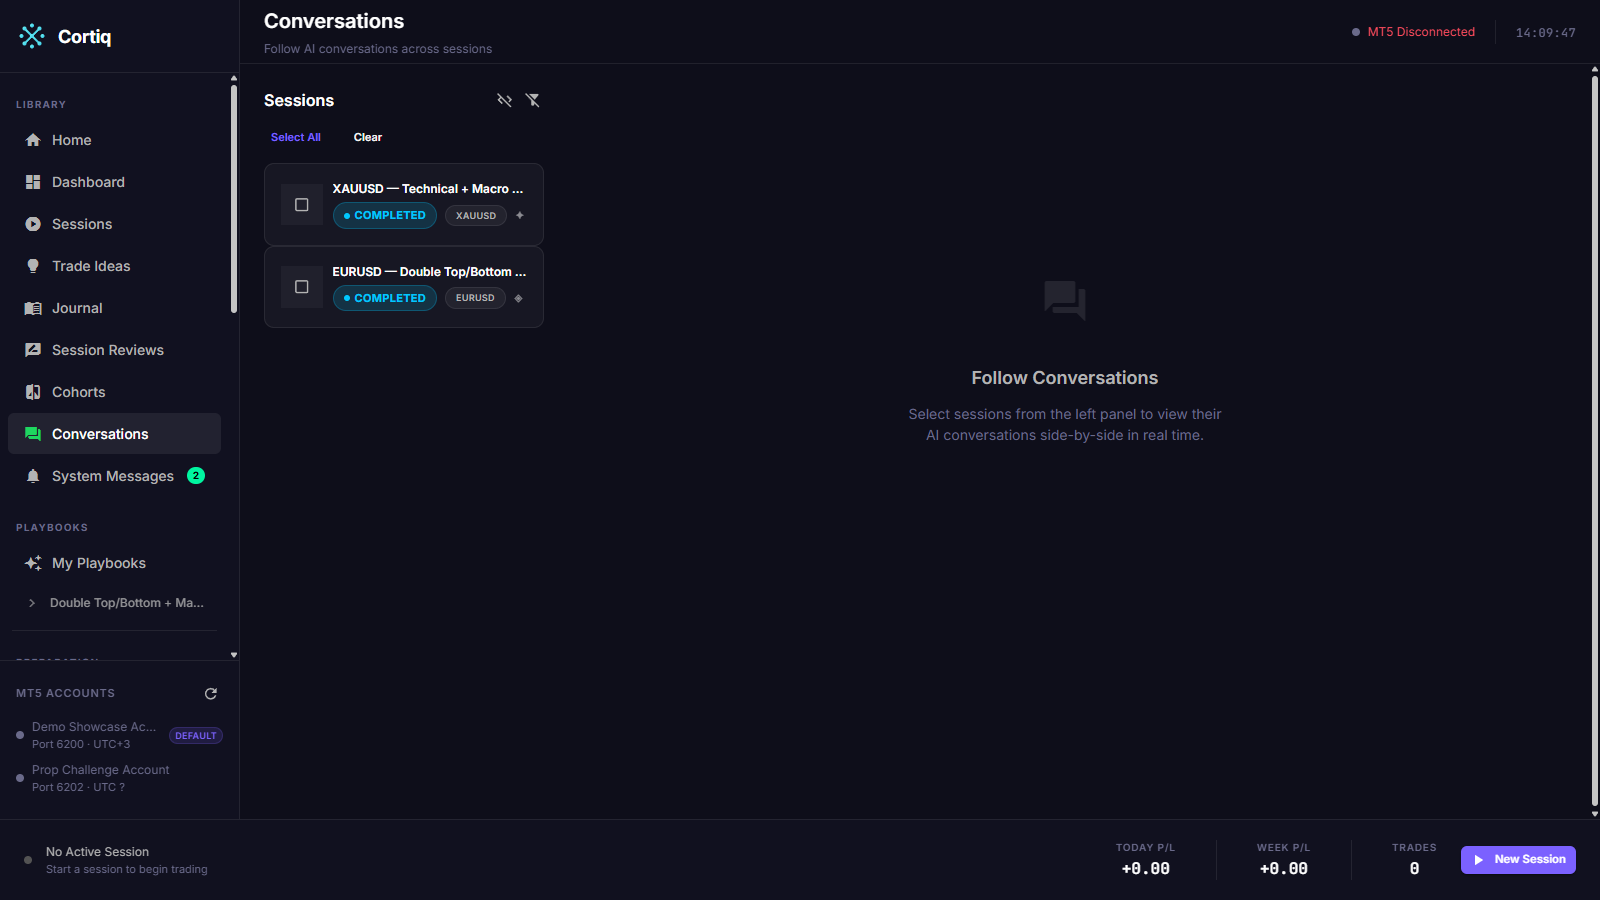
Conversations
Section titled “Conversations”Conversations is the raw cross-session AI dialogue view. Use it to follow what the model is saying across multiple sessions in parallel, compare reasoning between sessions, and inspect the prompt and response directly instead of the summarized journal text.
System messages can be hidden or shown — keep them hidden for daily review, show them when something looks wrong.
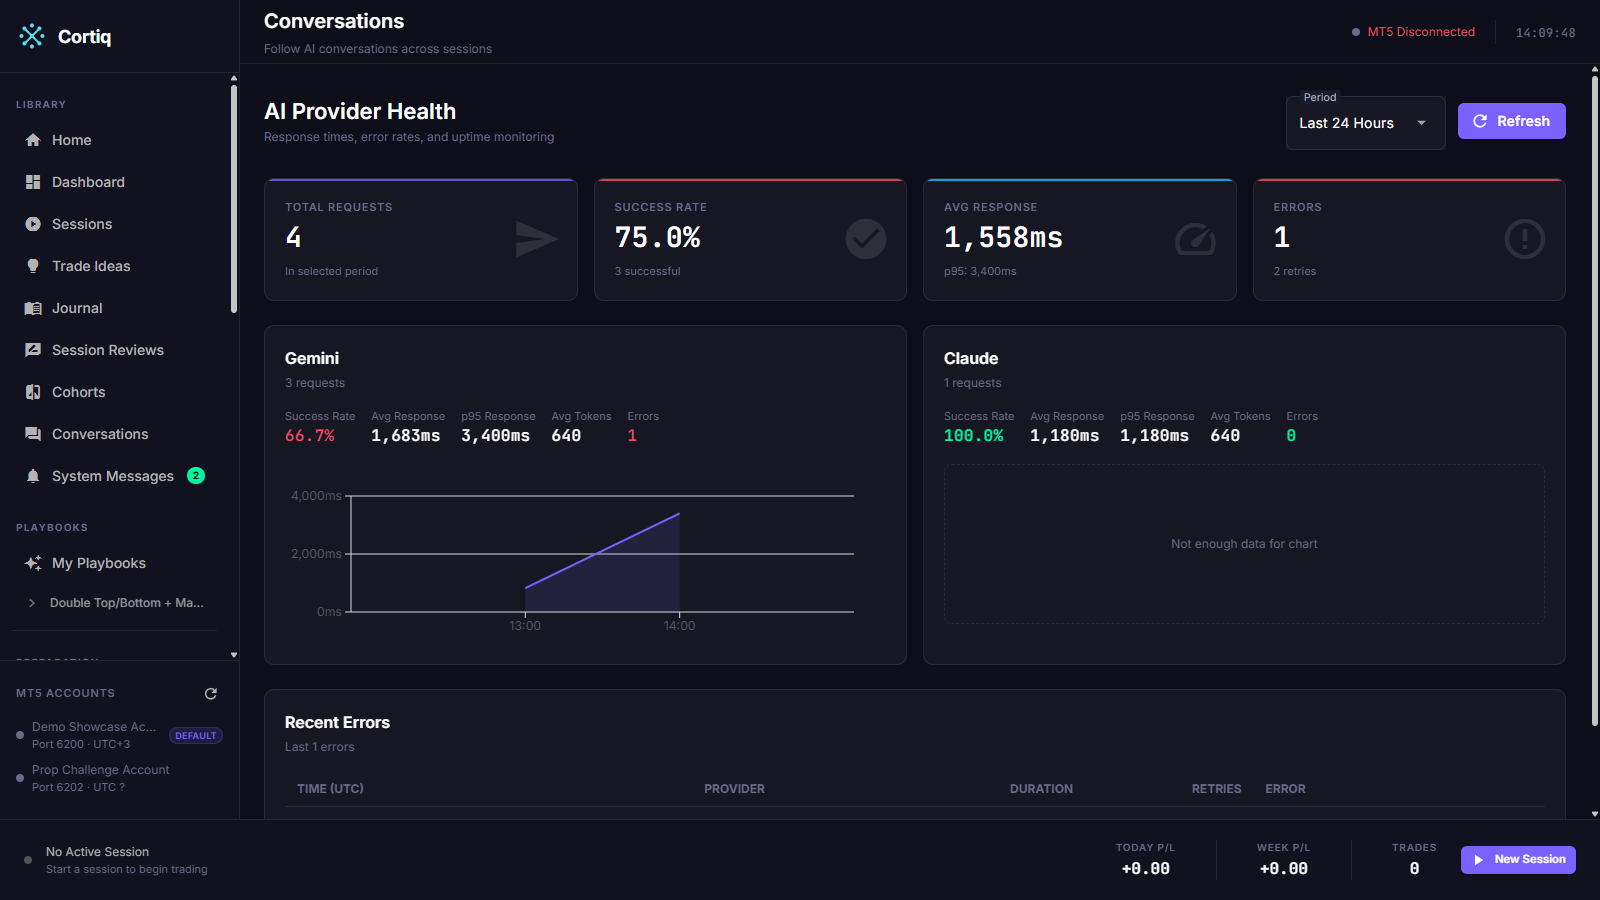
Provider Health
Section titled “Provider Health”Provider Health is the AI-provider diagnostics screen under Tools. It shows request volume, success rate, average and p95 response time, retry counts, and recent errors per provider. Each provider also carries an auth/verdict badge that reports whether its credentials currently authenticate — the same preflight check that blocks a session from starting on an unauthenticated provider.
Open this screen to answer two questions: is the strategy underperforming, or is the provider route unhealthy? and is this provider actually authenticated right now?
NowTradingBar
Section titled “NowTradingBar”The NowTradingBar runs along the bottom of the app whenever a session is active. It shows the live cycle’s session name, symbol, current phase, and most recent decision — without leaving whatever screen you’re on.

Reference
Section titled “Reference”Operational features that live in Settings but shape what you see in the workspace:
| Path | What it controls |
|---|---|
Settings → AI Providers | Per-feature provider overrides used during sessions. |
Settings → Notifications | Delivery channels: Windows Toast, X, Telegram. |
Settings → Reports | Scheduled performance reports sent to your channels. |
Common questions
Section titled “Common questions”A daily flow that works:
- Open
Hometo orient. - Open
Dashboardto inspect the broader environment. - Open
Sessionsto control active runs. - Skim
System Messagesfor anything that fired overnight. - Use
Journal,Session Reviews,Cohorts, andConversationsto review. - Check
Provider Healthwhen AI responsiveness, reliability, or authentication looks off.
Where do I start a session?
From Sessions (the list view) or from an active idea on Trade Ideas. Both routes open the same session-create dialog.
Why is one session showing RiskPaused?
A risk validator triggered. Open the session detail and check the risk panel — it shows the breach condition. The session resumes automatically when the breach clears.
What to read next
Section titled “What to read next”- App navigation guide — maps these screens to the actual sidebar entries in the desktop app.
- Sessions — what’s behind the Sessions screen.
- Session review — the learning loop behind the Session Reviews screen.
- System messages — the event list behind the System Messages inbox.
- Journal & analytics — what’s behind the Journal and Cohorts screens.