Charting
This page explains Cortiq’s chart: where it appears in the app, what you can do on it, and how to read the markers and price lines it draws. By the end you’ll know how to add an indicator, read a trade marker, and open the chart attached to a piece of research.
What this is
Section titled “What this is”Cortiq draws candlestick charts in four places, all using the same chart component:
| Where | What it shows |
|---|---|
| Session detail | A live chart for the session’s instrument, streaming from MT5 |
| Backtest detail | The historical replay, drawn up to the replay cursor |
| Journal | The candles around a completed trade |
| Instrument Hub | The candles around a piece of recorded evidence |
Every chart shows a volume histogram beneath the price bars. It uses broker-reported real volume when available and tick volume otherwise.
The live session chart
Section titled “The live session chart”The session chart sits between the session statistics and the tabs, and is always visible while the session is open.
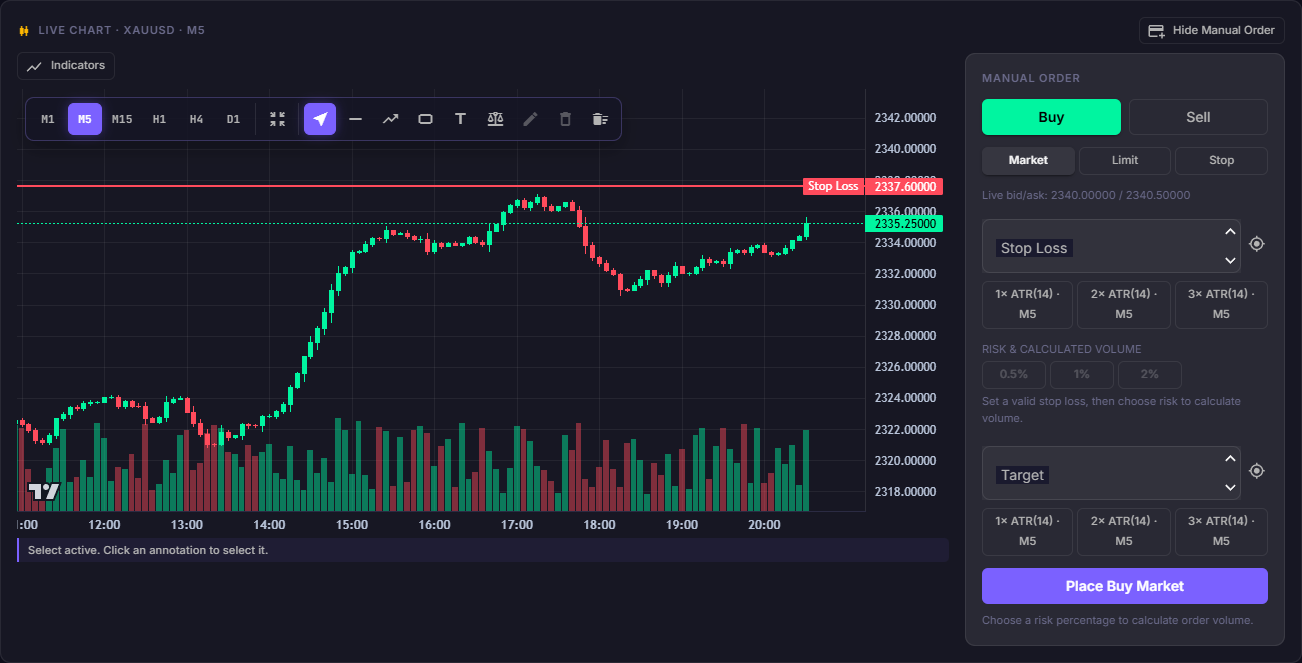
It streams ticks from your MT5 terminal and builds the forming candle from them. When a candle closes, Cortiq replaces the tick-built bar with the broker’s own values, so a partially formed bar corrects itself without a reload.
Timeframes and history
Section titled “Timeframes and history”Switch timeframes with the toolbar: M1, M5, M15, H1, H4, D1.
Scroll left and Cortiq fetches older candles automatically as you approach the edge of what is loaded. Scroll far enough forward and it fetches newer ones. Your viewport position is preserved when history is prepended.
If the tick feed goes quiet for 30 seconds, a stale-feed indicator appears and Cortiq attempts to resubscribe.
Drawing tools
Section titled “Drawing tools”The toolbar offers horizontal lines, trend lines, rectangles, text, and a risk/reward tool that measures a ratio from an entry, a stop, and a target. Drawings persist for the session while the app is running.
The in-app Copilot can draw onto the same chart when you ask it to mark a level or a zone.
Indicators
Section titled “Indicators”Select Indicators to open the catalogue. Cortiq calculates indicator values in its own engine rather than in the browser, and the chart renders the result.
You can add the same indicator more than once with different settings — an EMA 20 and an EMA 50, for example — and edit or remove each instance independently.
Markers and price lines
Section titled “Markers and price lines”| What you see | What it means |
|---|---|
| Blue or orange arrow on a candle | A trade was opened on that candle, buy or sell |
| Solid horizontal line | The entry price of an open position |
| Dashed red line | A stop loss |
| Dashed green line | A take profit |
| Dashed lines while the ticket is open | The stop and target you are planning, before you submit |
| Marker on the decision rail | A point where the autonomous agent made a decision |
The backtest replay chart
Section titled “The backtest replay chart”Both manual and autonomous backtests open onto a chart.
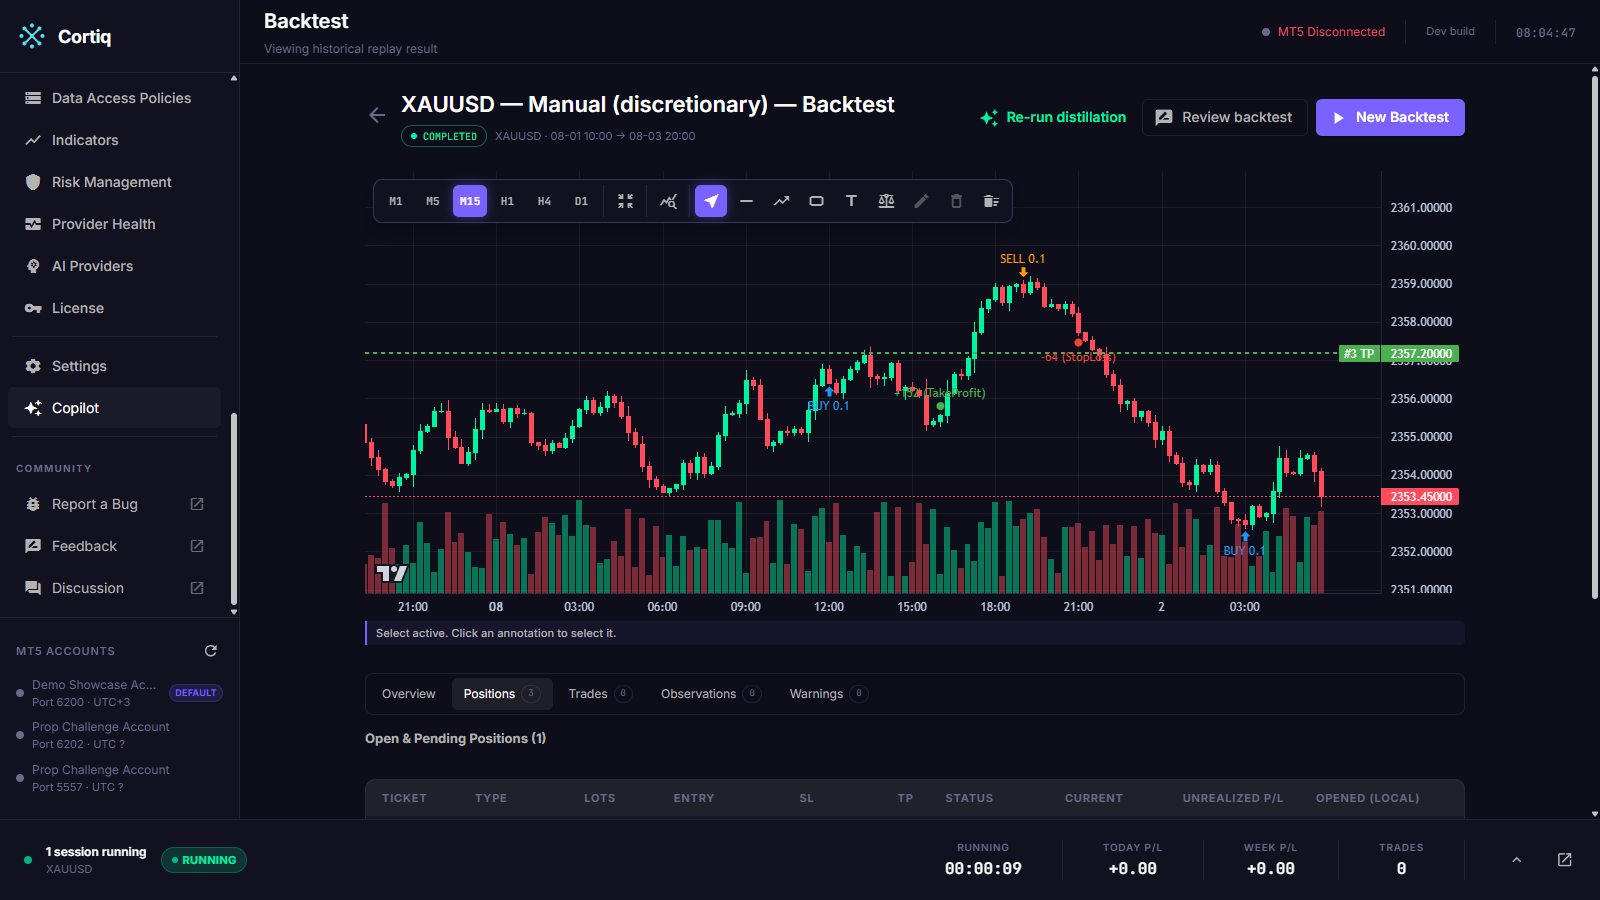
The chart is drawn only up to the run’s replay cursor. That cursor is a hard cutoff: candles after it are never fetched, so a manual replay cannot show you what happened next. See Backtesting.
Evidence charts
Section titled “Evidence charts”A recorded observation opens onto the candles around the moment it describes.
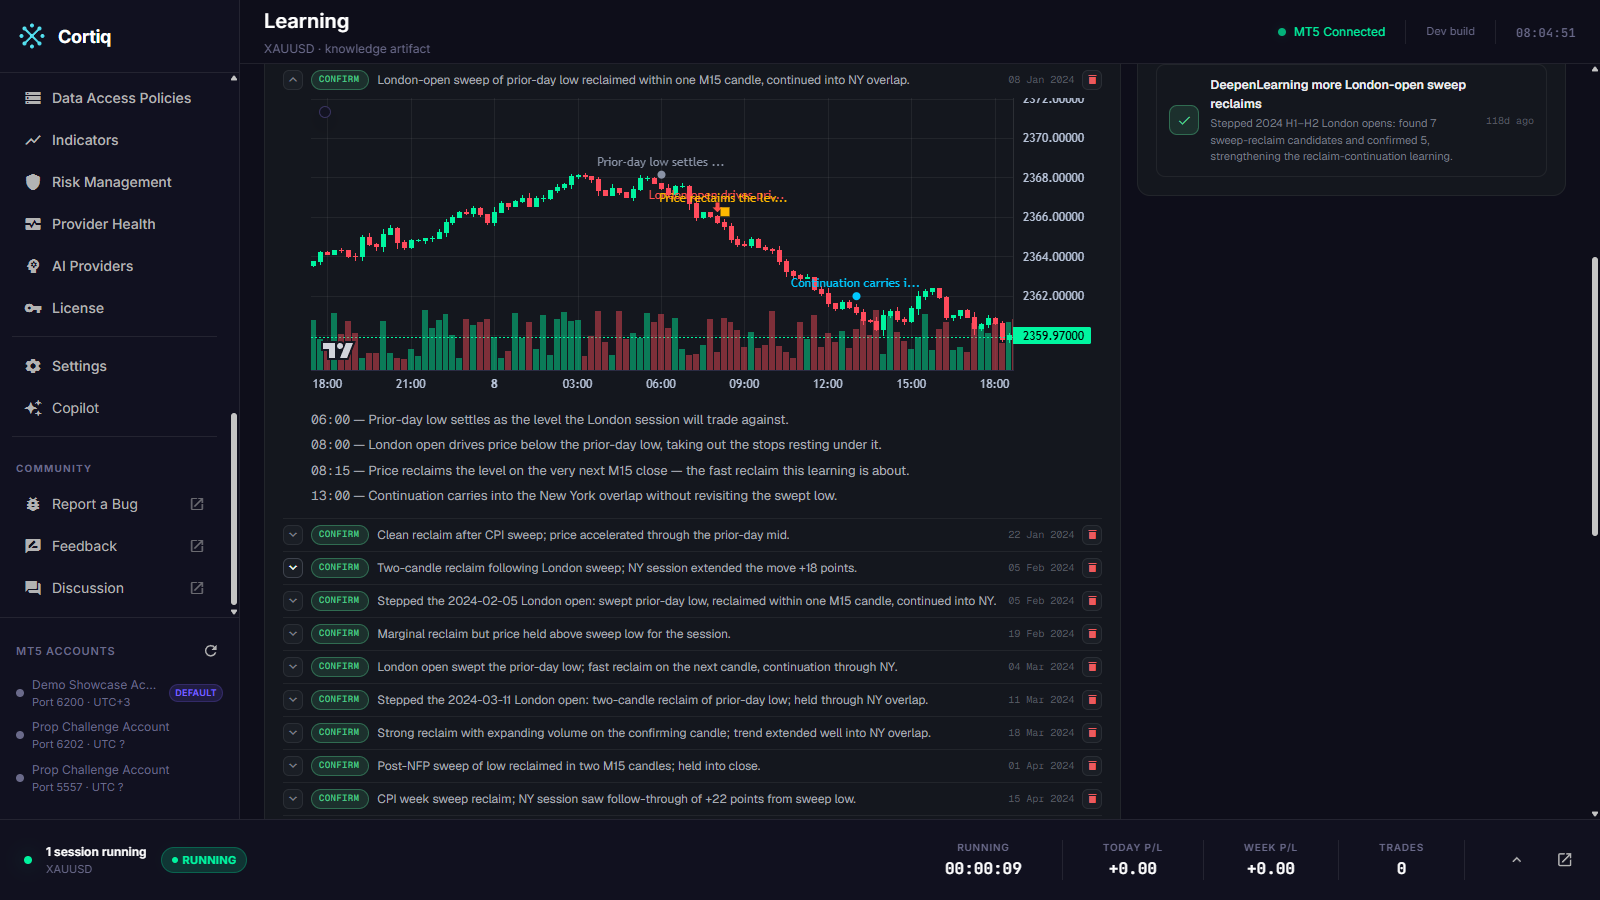
Where the AI’s write-up describes several moments — a level forming, a sweep, a reclaim, an outcome — the chart draws one marker per moment, and each marker has its own timestamped sentence below the chart. The window spans from the earliest event to the latest.
Marker shapes follow a fixed vocabulary:
| Marker | Moment |
|---|---|
| Grey circle | A level formed |
| Red down arrow | A sweep |
| Green up arrow | A breakout |
| Orange down arrow | A reversal |
| Yellow square | A confirmation |
| Red square | An invalidation |
| Blue circle | The outcome |
Observations recorded before timed events were introduced show a single marker at the moment they were recorded.
Related pages
Section titled “Related pages”- Discretionary trading — placing orders from the chart.
- Backtesting — the replay cursor and manual replay.
- Instrument Hub — the evidence these charts are attached to.